Earth Notes: Saving Electricity and Gas (2018)
Updated 2026-03-29 17:23 GMT.By Damon Hart-Davis.


data (kWh: e used 1998, e gen -3806, g 3980).
Off-grid 83.0kWh captured by primary (MPPT) solar controller.
See the daily PV generation logs for 2018 as .csv and .png chart.
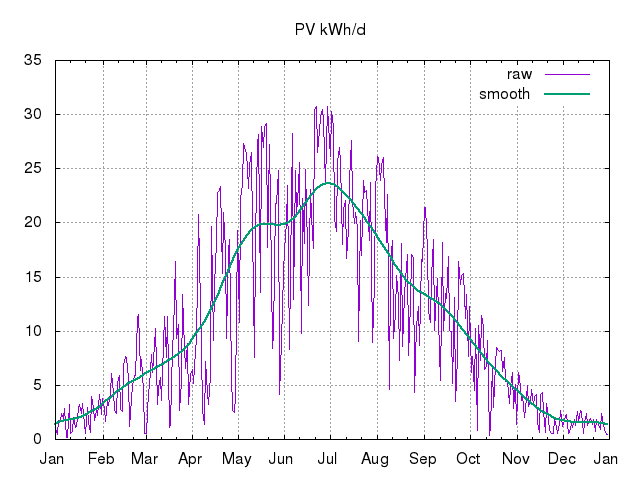

See gas use kWh and heating degree days (HDD) by time for 2018 as .csv and .png chart.

See gas kWh vs heating degree days (HDD) regression for 2018 as .png chart.
2018-02: this is the coldest February here at 16WW while I have been monitoring. But we're nowhere near our highest gas use, thanks to insulation and to Radbot/OpenTRV!
2018-04-03: according to @Zapaman, ~26.8% of [16WW] household energy is from renewables, 8.1% from nuclear and hence a total 34.8% from low carbon energy.
2018-05-07: on the hottest day over the Early May Bank Holiday weekend (ie since 1978) it is ~27°C in our shaded porch. A snapshot of heating performance from Pilio shows R^2=0.94 and a slope of ~2kWh/HDD (at 15.5°C baseline).
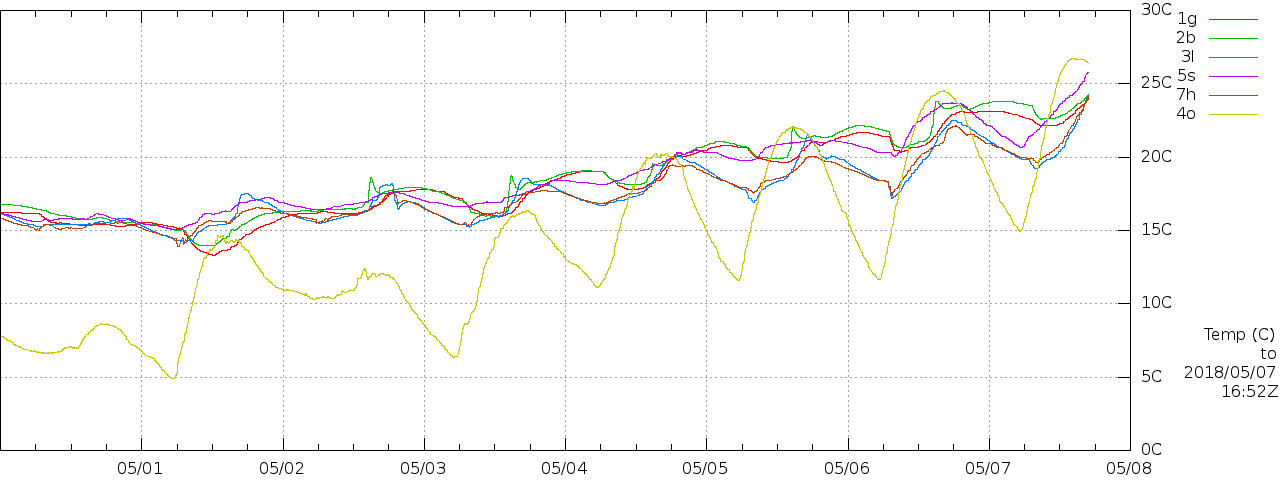

2018-06-10: ignoring the daytime PV flows showing up as consumption, the implication of my fine-grained Loop meter data is that overnight our vampire load is ~80--90W. Though that's likely not very accurate. It includes ~10W for the SmartThings monitoring that I use to cross-check OpenTRV devices. It probably excludes ~16W for the networking gear, since it's been mainly off-grid. Maybe ~40W is from the fridge, leaving ~40W for all other vampires. Still a little higher than I'd like, but not too shabby. (And possibly a figment of the Loop meter's imagination anyway!)
2018-07-10: I am contemplating grid-attached storage again. In principle something Tesla Powerwall 2 size should retain any generation for use in the house October to February inclusive, so no exports. Equally, such a beast should avoid any imports March to September. That relies on the storage system having both enough energy (kWh) and power (kW) capacity to absorb most/all generated PV and cover all loads. But a much smaller unit may get much of the same effect, maybe even as small as 1kWh/260W such as the Enphase AC Battery.
Notice how the 'excess' generation in June alone (a little under 500kWh) is about the same as the electricity deficit Oct to Feb inclusive... A mere 10t of containerised lithium battery could cover it. (Self-discharge of <3%/M helps.)
2018-07-26: DUKES Chapter 5 table 5D "Estimated carbon dioxide emissions from electricity supplied 2015 to 2017" shows tCO2/GWh (equivalently gCO2/kWh) of 335, 265, and 225. Those are different to those produced for the Greenhouse Gas Inventory (GHGI). Those numbers may not include transmission and distribution losses. It may be time to revisit the weightings applied to electricity and gas for computing 16WW overall energy footprint.
An Enphase AC Battery was fitted a couple of days ago, and seems to be working as intended. The night flows seem to have been reduced by about 20W according the Loop, and the Enlighten interface indicates less than ~20W of overnight consumption. (It is not yet clear if that is actual gross consumption or residual grid imports, though is probably the former.)
Looking at Enlighten I also see that my synthetic load pattern for our dishwasher is roughly confirmed. Looking at Loop I see various events including ~3kWh of gas for a bath for one of the kids this evening.
2018-08-28: looking at PV generation and exports in the morning, I see generation start at about 05:30:
20180828T03:00Z 0
20180828T05:32Z 6
20180828T05:33Z 9
20180828T05:34Z 9
20180828T05:35Z 10
20180828T05:36Z 11
20180828T05:37Z 12
20180828T05:38Z 11
20180828T05:39Z 12
20180828T05:40Z 11
...
20180828T07:00Z 170
20180828T07:01Z 177
20180828T07:02Z 206
20180828T07:03Z 227
20180828T07:04Z 244
20180828T07:05Z 259
20180828T07:06Z 275
20180828T07:07Z 284
20180828T07:08Z 293
20180828T07:09Z 301
Generation exceeds the capacity of the Enphase AC Battery to absorb it (and so starts to spill to grid) about 1.5h later:
20180828T06:59Z consumption.readingTime 1535439530 consumption.net.wNow 21.79 consumption.total.wNow 197.884 production.wNow 176.094 storage.percentFull 41 storage.wNow -154 storage.readingTime 1535439384
20180828T07:04Z consumption.readingTime 1535439830 consumption.net.wNow 5.823 consumption.total.wNow 269.748 production.wNow 263.925 storage.percentFull 42 storage.wNow -157 storage.readingTime 1535439688
20180828T07:09Z consumption.readingTime 1535440130 consumption.net.wNow -45.651 consumption.total.wNow 281.107 production.wNow 326.758 storage.percentFull 43 storage.wNow -256 storage.readingTime 1535439989
20180828T07:14Z consumption.readingTime 1535440430 consumption.net.wNow -91.038 consumption.total.wNow 293.419 production.wNow 384.457 storage.percentFull 45 storage.wNow -269 storage.readingTime 153544028
Note that in August, due to worries about travel problems after a messy Brexit, we suspended our normal travel rule and flew to Majorca. The flights generated ~1tCO2 in total (ie four return flights), or ~2tCO2e including radiative forcing effects.
While we were away at the end of August, with almost everything possible turned off, base consumption was ~1.6kWh/d (1.4--1.8kWh/d), with a large excess of generation each day, and residual imports of ~0.16kWh/d. Minimum load (ie with fridge not running) ~20W.
With a flattish load (fridge/freezer largely) and ~12h/d useful PV generation, 0.8kWh/d imports would be expected, as seen last year. Reduction by ~80% ie ~0.65kWh/d is thus quite good! Another way of looking at this is self-consumption rising from ~50% to ~90%, almost as if the sun still shone at night!
Some software tweaks were also made to the off-grid system to work in concert with the Enphase which may have the effect of adding as much as 0.1kWh/d extra import avoidance. The overall first priority is to minimise imports (or maximise exports) to the grid when grid carbon intensity is high. The next priority is to minimise total imports and thus grid flows. Each of these two may save carbon emissions from electricity generation.
2018-10: shading from the regrowing tree to our south-east is causing some dip in mid-morning generation, as it did before the trim.
2018-11-26: I note from supply/generation meter reading tonight that over the last week, while total generation has been a very feeble ~10kWh, only ~2kWh was exported. So the Enphase battery is doing a decent job of maximising self-consumption, minimising wasteful export and re-import.
| 2018 | Electricity | Gas | |||
|---|---|---|---|---|---|
| Month | Consumed kWh (/d) | Generated -kWh (/d) | Consumed kWh (/d) | Period | Notes |
| 2018-01 | 214 (6.9/d) | -62 (-2.0/d) | 585 (19/d) | 20171231T18:45Z to 20180131T19:19Z (31d) | Meter readings: electricity generation 61.9kWh, export 35.3kWh, import 187.1kWh (thus net consumption (I+G-E) 213.5kWh), self consumption ((N-I)/N) 12%); gas ~52.7m^3 (so 585kWh @ 11.1kWh/m^3).
"SmartThings" sensors to cross-calibrate OpenTRV devices draw ~10W, thus add ~0.25kWh/d to gross electricity consumption. HDD12=166 vs 248 last January. |
| 2018-02 | 186 (6.6/d) | -104 (-3.7/d) | 746 (28/d) | 20180131T19:19Z to 20180228T18:32Z (28d) | Meter readings: electricity generation 146.6kWh, export 104.4kWh, import 143.8kWh (thus net consumption (I+G-E) 186.0kWh, self consumption ((N-I)/N 23%); gas ~67.2m^3 (so 746kWh @ 11.1kWh/m^3).
This has been the coldest February (in terms of HDD) that I have observed at 16WW. HDD12=237 vs 139 last February. |
| 2018-03 | 190 (6.1/d) | -216 (-7.0/d) | 559 (18/d) | 20180228T18:32Z to 20180331T17:10Z (31d) | Meter readings: electricity generation 216.4kWh, export 167.3kWh, import 141.0kWh (thus net consumption (I+G-E) 190.1kWh, self consumption ((N-I)/N) 26%); gas ~50.4m^3 (so 559kWh @ 11.1kWh/m^3).
A cold March, but not quite the coldest measured here! HDD12=185 vs 77 last March. |
| 2018-04 | 93 (3.1/d) | -290 (-9.7/d) | 137 (4.6/d) | 20180331T17:10Z to 20180430T17:06Z (30d) | Meter readings: electricity generation 290.4kWh, export 284.9kWh, import 87.6kWh (thus net consumption (I+G-E) 93.1kWh, self consumption ((N-I)/N) 6%); gas ~12.3m^3 (so 137kWh @ 11.1kWh/m^3).
HDD12=64 vs 65 last April. |
| 2018-05 | 160 (5.2/d) | -647 (-21/d) | 131 (4.2/d) | 20180430T17:06Z to 20180531T19:30Z (31d) | Meter readings: electricity generation 646.8kWh, export 553.0kWh, import 65.9kWh (thus net consumption (I+G-E) 159.7kWh, self consumption ((N-I)/N) 59%); gas ~11.8m^3 (so 131kWh @ 11.1kWh/m^3).
HDD12=23 vs 23 last May. |
| 2018-06 | 137 (4.6/d) | -680 (-23/d) | 103 (3.4/d) | 20180531T19:30Z to 20180630T21:52Z (30d) | Meter readings: electricity generation 689.2kWh, export 599.2kWh, import 56.0kWh (1.9kWh/d) (thus net consumption (I+G-E) 137.0kWh, self consumption ((N-I)/N) 59%); gas ~9.25m^3 (so 103kWh @ 11.1kWh/m^3).
Passed 8MWh generation on final (west-facing) PV segment. Tuning of off-grid PV storage control system is allowing ~0.5kWh/d load to be removed from grid consumption. HDD12=2 vs 1 last June. |
| 2018-07 | 139 (4.5/d) | -663 (-21/d) | 90 (2.9/d) | 20180630T21:52Z to 20180731T17:03Z (31d) | Meter readings: electricity generation 662.7kWh, export 575.7kWh, import 55.1kWh (1.8kWh/d) (thus net consumption (I+G-E) 139.1kWh, self consumption ((N-I)/N) 60%); gas ~8.13m^3 (so 90kWh @ 11.1kWh/m^3).
Passed 28MWh exports. HDD12=0 vs 0 last July. |
| 2018-08 | 107 (3.5/d) | -489 (-16/d) | 54 (1.7/d) | 20180731T17:03Z to 20180831T19:31Z (31d) | Meter readings: electricity generation 488.6kWh, export 412.1kWh, import 30.2kWh (0.97kWh/d) (thus net consumption (I+G-E) 106.7kWh, self consumption ((N-I)/N) 72%); gas ~4.88m^3 (so 54kWh @ 11.1kWh/m^3).
New Enphase AC-coupled battery installed on 6th. On holiday for 15 days later in month. Electricity imports down to 30kWh from 50kWh last August (1.5kWh/d to 0.97kWh/d), with drop on holiday days from ~0.8kWh/d to ~0.16kWh/d, and self-consumption up from 48% to 72%. HDD12=3 vs 1 last August. |
| 2018-09 | 159 (5.3/d) | -388 (-13/d) | 100 (3.3/d) | 20180831T19:31Z to 20180930T17:33Z (30d) | Meter readings: electricity generation 387.7kWh, export 276.6kWh, import 48.0kWh (1.6kWh/d) (thus net consumption (I+G-E) 159.1kWh, self consumption ((N-I)/N) 69%); gas ~9.00m^3 (so 100kWh @ 11.1kWh/m^3).
Electricity imports down to 48kWh from 91kWh last September (1.6kWh/d down from 3.2kWh/d), and self-consumption up from 37% to 69%. HDD12=20 vs 10 last September. |
| 2018-10 | 172 (5.5/d) | -207 (-6.7/d) | 208 (6.7/d) | 20180930T17:33Z to 20181031T19:12Z (31d) | Meter readings: electricity generation 206.5kWh, export 119.7kWh, import 85.0kWh (2.7kWh/d) (thus net consumption (I+G-E) 171.8kWh, self consumption ((N-I)/N) 51%); gas ~18.78m^3 (so 208kWh @ 11.1kWh/m^3).
Electricity imports down to 85kWh from 112kWh last October (2.7kWh/d down from 3.6kWh/d), and self-consumption up from 25% to 51%. With larger capacity/power storage self-consumption could nominally be ~100%, but in practice that might be ~20kWh/7kW given insolation patterns, vs current 1.2kWh/270W, so more than an order of magnitude larger to save remaining 2.7kWh/d imports. HDD12=60 vs 18 last October. |
| 2018-11 | 182 (6.1/d) | -82 (-2.7/d) | 451 (15/d) | 20181031T19:12Z to 20181130T20:29Z (31d) | Meter readings: electricity generation 82.2kWh, export 30.4kWh, import 129.6kWh (4.3kWh/d) (thus net consumption (I+G-E) 181.7kWh, self consumption ((N-I)/N) 28%); gas ~40.64m^3 (so 451kWh @ 11.1kWh/m^3).
Electricity imports down to 130kWh from 152kWh last November (4.3kWh/d down from 5.1kWh/d), and self-consumption up from 15% to 28%. Testing Radbot (especially a non-smart mechanical TRV simulation for trials) may have pushed up gas demand. HDD12=101 vs 128 last November. |
| 2018-12 | 194 (6.3/d) | -49 (-1.6/d) | 628 (20/d) | 20181130T20:29Z to 20181231T18:02Z (31d) | Meter readings: electricity generation 48.8kWh, export 8.2kWh, import 153.3kWh (4.9kWh/d) (thus net consumption (I+G-E) 193.9kWh, self consumption ((N-I)/N) 21%); gas ~56.59m^3 (so 628kWh @ 11.1kWh/m^3).
The heaviest electricity consumption of the year (since the Enphase was installed in early August, and through the following August anyhow) included cooking and two dishwasher runs on Christmas Day, totalling 11.8kWh. All of the 1.4kWh generated on the day was consumed locally, and very little went via the battery! Not clear why electricity consumption this month (6.3kWh/d) or this year (1998kWh) so high. Electricity imports down to 153kWh from 156kWh last December (4.9kWh/d down from 5.0kWh/d), and self-consumption up from 12% to 21%. Testing Radbot (especially a non-smart mechanical TRV simulation for trials) may have pushed up gas (and electricity) demand. HDD12=128 vs 187 last December. |
| 2018 total (Jan–Dec) | 1998 (5.47/d) | -3806 (-10.4/d) | 3980 (10.9/d) | 20171231T18:45Z to 20181231T18:02Z (365d) |
HDD (989 vs 897) means a little more heat demand, reflected in gas use.
Electricity use is unexpectedly high but generation is reasonable and self-consumption is improved with the Enphase AC Battery. Note that grid electricity carbon intensity dropped significantly again in 2018, which would reduce the benefit of our electricity exports, but previous (0.43kgCO2/kWh) figures will be used for comparison for now. |
| kgCO2 | 859kg (2.4/d) | -1712kg (-4.7/d) | 723kg (2.0/d) | ~-0.13tCO2 (~-0.36kgCO2/d) gas/electricity emissions total for 4 people, based on 0.43kgCO2/kWh for electricity (netted) and 0.19kgCO2/kWh for gas, ie slightly carbon negative. We did fly as a family London to Majorca return this year, pre-Brexit chaos, but we still do not own a car and travel almost entirely by (usually-electrified) public transport. | |