Earth Notes: Saving Electricity and Gas (2011)
Updated 2026-03-29 17:23 GMT.By Damon Hart-Davis.


data (kWh: e used 1578, e gen -3998, g 3936).
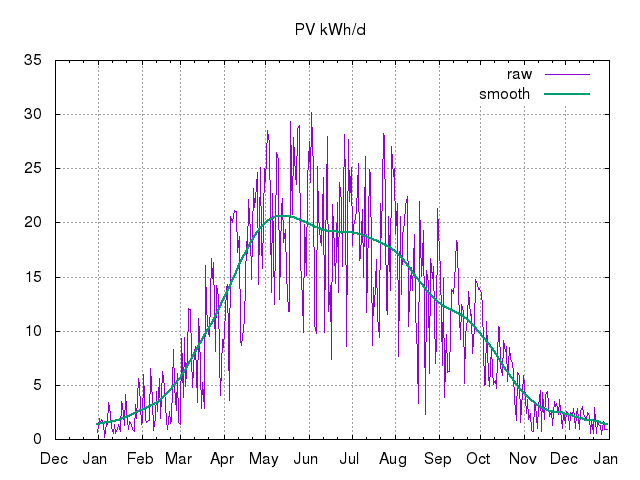
See the daily PV generation logs for 2011 as .csv and .png chart.
I aim to continue to meet or beat the targets set at the end of 2010:
- Electricity: 4.5kWh/d+0.2kWh/HDD12
- Gas: 5kWh/d+3kWh/HDD12
In August I set up an account with [archived] The European Citizens Climate Cup to see how it compares with iMeasure. After a few minutes' data entry (and fighting some glitches such as the site not understanding 'net metering' ie meters that run backwards), I was able to look at some pretty diagrams. One is below, reinforcing my belief that we use less than half the typical UK electricity and gas for our size and location:

Also in August I reviewed the AlertMe energy-monitoring kit for The Register. Amongst other things, it has convinced me that our "always on" electricity load / baseload is ~70W, mainly the fridge I suspect.
As of iMeasure's upgrade in September, with a HDD12 base, iMeasure reports:
Baseload = 27.82 Slope = 2.89 R = 0.942

The near-1.0 R/correlation figure implies that we are efficient, using heating based on actual external temperature. If our DHW and cooking were separate this might be even closer to 1.
The baseload seems to be a weekly kWh figure, ie ~4kWh/d for DHW/cooking, which is about right.
The slope of 2.89, presumably kWh/HDD, is again fairly close to the 3kWh/HDD measured and used as a target. Possibly I should lower our target a little, especially as the data used goes back to 2009 and we've been improving! Note that the (high-heat-demand) points at the right-hand end are all from around the exceptionally cold start and end of 2010.
(The following day, possibly as a result of on-going bug-fixing, the numbers were shown as Baseload = 31.38 Slope = 3.01. So slightly higher but still including values from 2009 of course.)
Having gone back and entered data for previous meters I now have a 4-year energy chart from autumn 2007 to end-summer 2011.
- Heating demand has dropped each year even though winters have not been getting milder.
- Peak heating demand has dropped from ~63kWh/d in 2007-12 to ~38kWh/d in 2011-01.
- The electricity meter from 2008-02 to 2009-09 was unratcheted and iMeasure objects to readings going backwards so that part of the chart is dubious (subtracting our next export from PV generation for the period gives ~3.1MWh consumption for that period, not including what was used locally).
- The extra historical data has adjusted our performance-line heating numbers to Baseload = 52.33 Slope = 3.17 R = 0.810, ie the old data makes us look worse now!
- I discovered that I have lost all meter readings for 2009-07: annoying!
")
An implication of this, with 3kWh/HDD12 and a typical 1070HDD12 year (3.21MWh), and the fact that our current gas combi is actually only ~80% efficient, is that our true heat demand for CH is now ~2.5MWh/y (and falling). That's somewhat over the heat storage capacity of one mythical buried milk-tanker (20kl/20t) at a delta-T of 80K (~90kWh/t for a delta-T of 80K, ~1.8MWh/tanker). A couple of tonnes (~60kWh/t at a delta-T of 50K, thus ~120kWh) could carry enough from mid-summer into autumn to postpone using gas for DHW for an extra month or so.
Note that the SheevaPlug stayed off-grid all year after the battery upgrade. (And some more tweaking of software to use less energy in the darkest periods.) And I haven't seen the controller light on amber or red even in December.
Carbon footprint for heat'n'light this year indicates, mainly due to the milder weather, that we're slightly carbon-negative (circa -300kgCO2 for the house for 2011), which is good.
That's assuming 0.43kgCO2/kWh electricity for both consumption and generation. At 0.5kgCO2/kWh we're at about -500kg for 2011 by the looks of things. (We're currently a net exporter until I can get ASHP in.)
Definitely not Passivhaus. But with heating at ~50kWh/m^2/year (ie gas use at <4MWh/y cf national average of 18MWh/y) I don't think we're doing too badly.
Disappointingly our gross electricity consumption has gone up a tiny bit.
(Note that we no longer have any incandescent bulbs other than in the oven and (oddly) fridge—we're all CFL and LED energy-saving lamps—nor any other easy low-hanging fruit in this area. Indeed we may have to use a bit extra to dehumidify the house in winter.)
HDD12 for year 820, much lower than previous years, with gas consumption ~3936kWh. So if baseline (DHW+cooking) is still 5kWh/day that leaves 2111kWh for space heating, or a little under 2.6kWh/HDD12. That can guide next year's target (down from 3.0kWh/HDD12).
As of 2011-12-31 imeasure.org.uk
is claiming Baseload = 50.46 Slope = 3.17 R = 0.810 under Weather Analysis.
Electricity targets could be tightened a little too. Maybe more like 4kWh/d+0.15kWh/HDD12 (with mean consumption currently ~4.3kWh/d over the year).
| 2011 | Electricity | Gas | |||
|---|---|---|---|---|---|
| Month | Consumed kWh (/d) | Generated -kWh (/d) | Consumed kWh (/d) | Period | Notes |
| 2011-01 | 159 (5.1/d) | -60 (-1.9/d) | 816 (26/d) | 20101231T18:06Z to 20110131T18:23Z (31d) | Meter readings: electricity generation 59.9kWh, export 38.1kWh, import 137.0kWh (thus net consumption (I+G-E) 158.8kWh); gas ~73.5m^3 (so 816kWh @ 11.1kWh/m^3).
SheevaPlug on grid (on mains electricity) about 8 days in total this month; new larger off-grid storage (~21d) should reduce on-grid time next winter! (Some notes... SheevaPlug off-grid evening of 3rd Jan as SLA controller indicator has finally gone green after some sunshine today. SheevaPlug SLA battery failed ~1am 9th Jan even after some decent sunshine in prev day or two, so definitely seems ill. SheevaPlug battery upgraded to 400Ah (~2kWh usable), going back off-grid evening of 14th Jan. Controller showing green and voltage 12V night of 27th; cut off to red/LVD just before 09:00 on 28th (with LiFePO4 carrying system for a few minutes until plug put back on-grid), battery voltage measured as 12.3V at controller minutes later but LVD not reset for about 3h after some sunshine.) Electricity/gas targets met for month (though missed one week in the month). HDD12=215 vs 316 last January. (Revised down from 231.) |
| 2011-02 | 132 (4.7/d) | -96 (-3.4/d) | 574 (20/d) | 20110131T18:23Z to 20110228T18:30Z (28d) | Meter readings: electricity generation 96.2kWh, export 70.7kWh, import 106.9kWh (thus net consumption (I+G-E) 132.4kWh); gas ~52m^3 (so 574kWh @ 11.1kWh/m^3).
SheevaPlug off-grid all month. Electricity targets met for month, gas targets just missed. HDD12=132 vs 232 last February. (Revised down from 140.) |
| 2011-03 | 158 (5.1/d) | -284 (-9.2/d) | 518 (17/d) | 20110228T18:30Z to 20110331T17:20Z (31d) | Meter readings: electricity generation 284.0kWh, export 239.2kWh, import 112.8kWh (thus net consumption (I+G-E) 157.6kWh); gas ~47m^3 (so 518kWh @ 11.1kWh/m^3).
Central heating off for the last few days of March. Electricity and gas targets met for month. HDD12=146 vs 165 last March. (Revised down from 152.) |
| 2011-04 | 122 (4.1/d) | -518 (-17/d) | 181 (6.0/d) | 20110331T17:20Z to 20110430T17:12Z (30d) | Meter readings: electricity generation 518.0kWh, export 465.8kWh, import 70.1kWh (thus net consumption (I+G-E) 122.3kWh); gas ~16m^3 (so 181kWh @ 11.1kWh/m^3).
Moved ADSL modem/WiFi off-grid early this month, saving maybe 0.2kWh/d mains. Total generation from the initial rounds of PV passed 7MWh and on the newest round passed 1MWh this month. Electricity and gas targets met for month. HDD12=33 vs 82 last April. (Revised down from 36.) |
| 2011-05 | 124 (4.0/d) | -648 (-21/d) | 176 (5.7/d) | 20110430T17:12Z to 20110531T17:26Z (31d) | Meter readings: electricity generation 647.7kWh, export 585.2kWh, import 61.1kWh (thus net consumption (I+G-E) 123.6kWh); gas ~16m^3 (so 176kWh @ 11.1kWh/m^3).
Moved ADSL modem/WiFi back on-grid mid month since main battery getting low. Passed 9MWh total generation at the end of the month. Electricity and gas targets met for month. HDD12=24 vs 66 last May. (Revised down from 30.) |
| 2011-06 | 120 (4.0/d) | -591 (-20/d) | 166 (5.5/d) | 20110531T17:26Z to 20110630T17:08Z (30d) | Meter readings: electricity generation 590.5kWh, export 531.7kWh, import 60.9kWh (thus net consumption (I+G-E) 119.7kWh); gas ~15m^3 (so 166kWh @ 11.1kWh/m^3).
Passed 8MWh generated on the first generation meter and 5MWh exported. Electricity and gas targets met for month. HDD12=10 vs 8 last June. (Revised down from 15.) |
| 2011-07 | 122 (3.9/d) | -587 (-19/d) | 155 (5.0/d) | 20110630T17:08Z to 20110731T17:15Z (31d) | Meter readings: electricity generation 587.3kWh, export 527.5kWh, import 62.4kWh (thus net consumption (I+G-E) 122.2kWh); gas ~14m^3 (so 155kWh @ 11.1kWh/m^3).
Sunny Beam showing 9999.10kWh generated up to night of 2011-07-30; end of month generation readings sum to 10189.3kWh with 10022.3kWh on Sunny Beam. Carbon footprint so far for 2011 = approx -440kgCO2 ie negative; from ~490kgCO2 (gas) and -930kgCO2 (electricity). Electricity and gas targets met for month. HDD12=1 vs 0 last July. |
| 2011-08 | 103 (3.0/d) | -525 (-15/d) | 105 (3.1/d) | 20110731T17:15Z to 20110903T17:12Z (34d) | Meter readings: electricity generation 524.8kWh, export 480.1kWh, import 58.3kWh (thus net consumption (I+G-E) 103.0kWh); gas ~9m^3 (so 105kWh @ 11.1kWh/m^3).
Away on holiday thus EOM readings delayed and consumption low. Metered exports passed 6MWh and generation on the first meter passed 9MWh. Electricity and gas targets met for month. HDD12=2 (for just August) vs 4 last August. (First 3 days of Sept add little.) |
| 2011-09 | 123 (4.6/d) | -313 (-12/d) | 163 (6.0/d) | 20110903T17:12Z to 20110930T17:15Z (27d) | Meter readings: electricity generation 313.0kWh, export 267.4kWh, import 77.8kWh (thus net consumption (I+G-E) 123.4kWh); gas ~15m^3 (so 163kWh @ 11.1kWh/m^3).
Electricity target met for month, gas not. HDD12=6 (for all September) vs 19 last September. |
| 2011-10 | 134 (4.3/d) | -223 (-7.2/d) | 170 (5.5d) | 20110930T17:15Z to 20111031T18:28Z (31d) | Meter readings: electricity generation 222.8kWh, export 186.9kWh, import 98.2kWh (thus net consumption (I+G-E) 134.1kWh); gas ~15m^3 (so 170kWh @ 11.1kWh/m^3).
Heating not turned on this month. Electricity and gas targets met for month. HDD12=31 vs 62 last October. |
| 2011-11 | 149 (5.0/d) | -87 (-2.9/d) | 347 (12d) | 20111031T18:28Z to 20111130T18:04Z (30d) | Meter readings: electricity generation 86.6kWh, export 61.4kWh, import 122.9kWh (thus net consumption (I+G-E) 148.9kWh); gas ~31m^3 (so 347kWh @ 11.1kWh/m^3).
Heating turned on early this month. (The first time, briefly, on 4th Nov.) Electricity and gas targets just missed for month. HDD12=66 (second warmest UK November and autumn on record) vs 185 last November (and 78 the previous November). |
| 2011-12 | 136 (4.4/d) | -57 (-1.8/d) | 566 (18/d) | 20111130T18:04Z to 20111231T18:12Z (31d) | Meter readings: electricity generation 57.3kWh, export 36.5kWh, import 116.6kWh (thus net consumption (I+G-E) 136.4kWh); gas ~51m^3 (so 566kWh @ 11.1kWh/m^3).
Slightly off month targets with house empty for 3 days over holidays but two parties here one weekend... SheevaPlug still off-grid with plenty of juice in the main battery bank. Electricity and gas targets met for month. HDD12=154 vs 340 last December (and 250 the previous December). |
| 2011 total (Jan–Dec) | 1578 (4.32/d) | -3988 (-10.9/d) | 3936 (10.8/d) | 20101231T18:06Z to 20111231T18:12Z (365d) | Electricity import (1081kWh) and consumption close to 2010, generation up 10%. Electricity bill reports import for 2011 was 1093kWh with predicted costs for 2012 at current rates £192 (@~13p/kWh+sc). Gas consumption down more than 30% on last year with HDD12 down ~45% (to 820); Space heating demand has dropped to ~2.6kWh/HDD12 (from 2.7 last year). DHW has accounted for approximately 50% of gas/heat demand this year, so solar thermal to as much as halve that is looking increasingly attractive. Gas bill reports consumption for 2011 was 4168kWh with predicted costs for 2012 at current rates £286 (@~4p/kWh+sc). |
| kgCO2 | 678kg (1.9/d) | -1715kg (-4.7/d) | 748kg (2.0/d) | ~-0.29tCO2 (~-0.79kgCO2/d) gas/electricity emissions total for 4 people, based on 0.43kgCO2/kWh for electricity (netted) and 0.19kgCO2/kWh for gas, ie slightly carbon negative. Note that we have not flown this year again, we still do not own a car and travel almost entirely by (usually-electrified) public transport. | |