Earth Notes: On iButton Temperature Logging Insulation Upgrade (2011 to 2014)
Updated 2026-03-22 10:12 GMT.By Damon Hart-Davis

Measuring How A Room Behaves Thermally
We're never going to hit Passivhaus levels of insulation or air-tightness. But this should give us a clue where real remaining returns may be lurking, getting us closer to the goal of no space heating needed at all, and thus minimised bills and carbon footprint.
Nick Taylor very kindly donated/lent me a number of bits of kit , including four iButton temperature sensors. (DS1921G-F5 "Thermochron" devices and USB reader; each is capable of recording 2048 data points at regular intervals.) With them I hope to monitor temperature in and around the room over an extended period (a year or more if possible). I aim to use sampling intervals of ~1h reflecting the time scales of forced temperature changes, eg from putting radiators on before bed.
I expect to use a finer granularity to start with. Then when I get bored of crawling around in the loft to download data, etc, drop to a coarser measurement interval.
| Number | Device ID | Target Location |
|---|---|---|
| 1 | A70000002B776221 | In floor void under room. |
| 2 | A70000002B82C321 | In room ~mid-height (~1m up). |
| 3 | A70000002B9A4F21 | Just above ceiling plasterboard in loft (under most of the loft insulation). |
| 4 | A70000002BAE8D21 | Above loft insulation. |
: Mission 1

For the start of this 'mission' beginning early afternoon , expected to run until about the start of November, I have reset all four iButtons to take samples every 30 minutes (in °C) (so should last just over 42 days before filling up), no roll-over allowed, synced to my laptop's time and with low- and high- temperature alarms at 0/40. Initially I am going to let them sit together to calibrate against one another.
I will deploy the ones that I can (into the loft) later the same day. But the others may have to wait until work on the room is completed which may take several more days.
Initial samples when all four were left stacked together on my desk at an ambient temperature of ~19.6°C, in .csv files:
1,
2,
3,
4. All are showing in the middle samples 19.5°C or 20°C which indicates an accuracy/precision of 0.5°C and all reasonably close. The timestamps in the .csv files indicate BST, ie local time, rather than UTC, so I may have to be careful with 'missions' that cross BST/UTC boundaries.
By BST (15:40 UTC) all four buttons had been deployed, with the following caveats:
- Pinned (in small plastic bag) to joist in floor void quite close to rad pipes and exterior wall (and possibly in a draught) so will probably show wild temperature swings. This may have to be moved during remaining insulation/redecoration works on room.
- Pinned (in small plastic bag) behind door out of the way for now. This may have to be moved during remaining insulation/redecoration works on room.
- In small plastic bag. Actually next to loft hatch above landing for ease of access, not actually above room but only a few inches at most from its perimeter.
- As stated, pinned to rafter hanging approximately above centre of room.
After about 24 hours I took current samples from under-floor and in-room. (The room has had the windows wide open all day and night to dry the plaster.)
These show the floor void to be a little better sheltered than I'd feared. (The temperature dropped much less overnight than in the room.) See .png graph.
BST: with all the internal wall insulation (IWI) work done (including the aerogel-filled window reveals today) I will be closing the windows for a few days. I will keep the doors shut at night, to get an indication of the thermal performance of the rooms unheated. Forecast daytime max temperature is ~16°C and night min ~6°C.
BST: with the room windows closed, external temperatures dropping, and no heating on, the temperature under the floor can be seen to be dropping much more at night. Probably due to the draught/infiltration that can be felt by hand from outside!
See .png graph.
and : the room was being primed and painted, so windows were open during the day and at night.
: radiators being fitted (etc) in late afternoon/evening (and air-infiltration under the floor greatly reduced with squirty foam), so windows open and iButton 1 displaced to behind the door for the duration. After all done, windows closed and another set of readings captured:
See .png graph.

(: in early afternoon briefly opened window to dissipate some paint fumes and let in some sunlight and again briefly a couple of times more, but room otherwise remaining shut/curtained from morning of 22nd for about 3 days.)
: now with all four sensors graphed, the dramatic swings in the loft temperature (4/purple) can be clearly seen, while over the last 3 days the underfloor (1/red) is much more stable suggesting that the air infiltration probably has been reduced.
See .png graph.
: with the room now occupied for a few days (and heating still not on) temperatures seem to be drifting slowly upwards. (Only sensors 1 and 2 updated this time. Sensor 2 has moved to the bookcase.) Note that the .csv files a given in local time, so there's a 'repeat' hour starting at 1am on the 30th as the clocks went back. (A spike up to 20°C on sensor 1 and 21°C on sensor 2 can be seen at 12:12 as the readings were taken on the laptop; glitches to be expected.)
See .png graph.
: central heating went on briefly a little before 6pm today. A fairly sharp rise by 1.5°C to 19°C at 18:42 can be seen for sensor 1 probably as expected due to its proximity to the CH pipe run; the room itself only got to 19.5°C.
: external temperatures have been between about 14°C; day and 11°C night. (Only sensors 1 and 2 updated this time.) There is just over a fortnight's life left of this mission: I still expect to see heating on before its end.
See .png graph.
: after sudden panic that I did not know actually depth of loft insulation (which I then measured as 240mm–300mm approximately), I took the opportunity to take readings from the two sensors in the loft (and move the 'above ceiling' sensor 3 more directly over the room. Did not want to disturb the carpet again so did not read sensor 1.
See .png graph.
: after death of W7 laptop (again) spent much of the day trying to get some sort of reader (preferably Java) working on Linux (SheevaPlug) or OS X. So readings for sensor 2 reflect that of my desk rather than Morgan's room! I am managing to cobble something together using owfs directly on the SheevaPlug, having failed to get anything Java-y to work there on the Mac. The initial data set showed a bizarre 31-day offset, ie one month out.
- in 2
.dat*nx timestamp and degrees C
See .png graph.
On my system command to mount owfs is:
/opt/owfs/bin/owfs --allow_other -C -u -m /owfsmnt/
For install, background, etc, see for example:
owfs(One Wire FileSystem) on SourceForge.- iButton/1-Wire in the Ubuntu forums.
- Installing 1-wire USB adapter DS9490R on Ubuntu 9.04 noting in particular the other packages to
apt-getfirst:automake autoconf autotools-dev gcc g++ libtool libusb-dev fuse-utils libfuse-dev swig python2.4-dev tcl8.4-dev php5-dev. - script cobbled together to extract data from
owfs.

: taking samples and ending mission 1 shortly after noon today, using owfs:
- under 1
.dat*nx timestamp and degrees C - in 2
.dat*nx timestamp and degrees C - ceiling 3
.dat*nx timestamp and degrees C - loft 4
.dat*nx timestamp and degrees C
See .png graph.
: Mission 2
I have started mission 2, with buttons in the same places. There is now a more (synchronised) sampling of once per hour on the hour starting at approximately UTC.
The owfs reader still sees a time 1 month out from the Windows 7 reader. Grrr.
: a quick sample of the in-room sensor (2) shows that temperature was never below about 18°C overnight even though outside was about 4°C at 07:30-ish. Handily preceded by a little late afternoon sunshine ie local greenhouse effect!
- in 2
.dat*nx timestamp and degrees C
See .png graph.
: another quick sample:
- in 2
.dat*nx timestamp and degrees C
See .png graph.
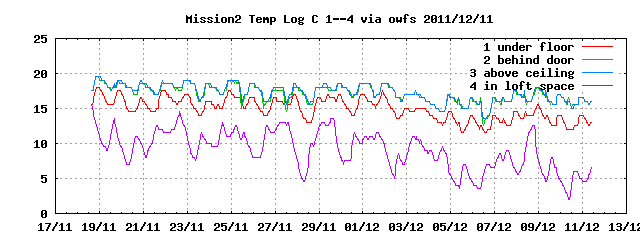
: a full sample set, from owfs:
- under 1
.dat*nx timestamp and degrees C - in 2
.dat*nx timestamp and degrees C - ceiling 3
.dat*nx timestamp and degrees C - loft 4
.dat*nx timestamp and degrees C
See .png graph.
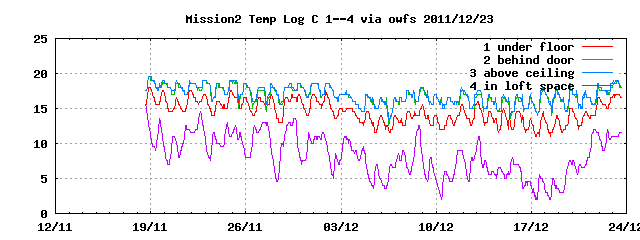
: a full sample set, from owfs:
- under 1
.dat*nx timestamp and degrees C - in 2
.dat*nx timestamp and degrees C - ceiling 3
.dat*nx timestamp and degrees C - loft 4
.dat*nx timestamp and degrees C
See .png graph. (Note that MHRV went in a couple of days ago, so there should be less drop in daytime temperature inside from opening windows to air and disperse humidity.)
: just the in-room sensor (2) shows that temperatures have been rock solid over the last couple of days while the house has been empty (13.5°C) and the MHVR off:
- in 2
.dat*nx timestamp and degrees C

: a full sample set, from owfs:
- under 1
.dat*nx timestamp and degrees C - in 2
.dat*nx timestamp and degrees C - ceiling 3
.dat*nx timestamp and degrees C - loft 4
.dat*nx timestamp and degrees C
See .png graph. (The expected reductions in room-temperature fluctuations seem to be there.)
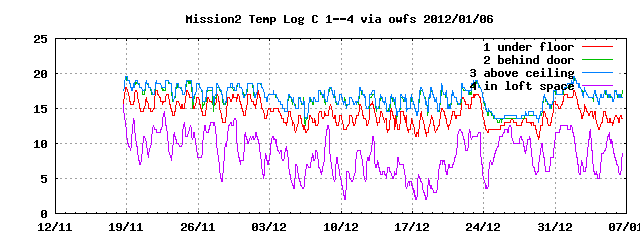
: the full and final sample set, from owfs:
- under 1
.dat*nx timestamp and degrees C - in 2
.dat*nx timestamp and degrees C - ceiling 3
.dat*nx timestamp and degrees C - loft 4
.dat*nx timestamp and degrees C
See .png graph.
The temperature in the loft actually dipped below freezing a couple of times for the first time this winter.
It is difficult to tell for sure without some slight effort in analysis, but with the MHRV the daily swing in bedroom temperature is down to about 2°C or less from 4°C-ish with having to open and close windows each day to dispel moisture.
The temperature under the floor is still getting lower than I'd like, presumably through a mixture of air leakage and thermal bridging through the joist that the sensor is next to.
(It is warm and sunny enough today to open windows and turn off the MHRV!)
: Mission 3
Now that the bulk of winter is behind us I hope (), I shall measure a different set of temperatures, though still including (2) from the boy's room in the set.
| Number | Device ID | Target Location |
|---|---|---|
| 1 | A70000002B776221 | Girl's room 1m–2m from floor. |
| 2 | A70000002B82C321 | Boy's room 1m–2m from floor. |
| 3 | A70000002B9A4F21 | Living room 1m–2m from floor. |
| 4 | A70000002BAE8D21 | Outside, under shelter, 1m–2m from ground. |
Due to complete in just over 85 days at the end of . (2048 samples 1h apart, approx on the hour, starting UTC.)
This data set should also allow me to calibrate actual HDD (heating degree days) against my usual London Heathrow (LHR/EGLL) data set.
BTW, the *nx "date -d @sec" command is very useful for checking the outputs of the owfs-extract.sh command (eg to adjust the fudge factor), where 'sec' is the time in seconds since the *nx epoch.
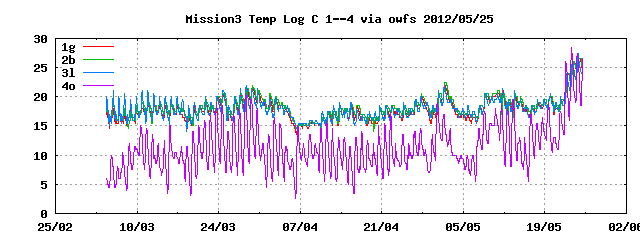
: a full sample set, on an afternoon warm enough to have windows open, from owfs:
- girl's room 1
.dat*nx timestamp and degrees C - boy's room 2
.dat*nx timestamp and degrees C - living room 3
.dat*nx timestamp and degrees C - outside 4
.dat*nx timestamp and degrees C
See .png graph.
The living room temperature rises higher than I expected (overshoots compared to the normal evening setting of ~18°C) and falls faster than I thought. Note that the heating goes off on the timer at about 21:45.
The overshoot may in part because of the way we turn up the temperature to force the heating on if necessary a little while before the children go to bed (and we set their rad TRVs to 2 at that point), and/or it may partly be the mechanical hysteresis in the room thermostat.

: a full sample set, on an afternoon warm enough to have windows open, from owfs:
- girl's room 1
.dat*nx timestamp and degrees C - boy's room 2
.dat*nx timestamp and degrees C - living room 3
.dat*nx timestamp and degrees C - outside 4
.dat*nx timestamp and degrees C
See .png graph.
: final full sample set, running to :
- girl's room 1
.dat*nx timestamp and degrees C - boy's room 2
.dat*nx timestamp and degrees C - living room 3
.dat*nx timestamp and degrees C - outside 4
.dat*nx timestamp and degrees C
See .png graph.
: Mission 4
Button deployment as for mission 3 (see table below), with 2-hour (120m) sampling starting at UTC, so should last 170 days thus into November.
| Number | Device ID | Target Location |
|---|---|---|
| 1 | A70000002B776221 | Girl's room 1m–2m from floor. |
| 2 | A70000002B82C321 | Boy's room 1m–2m from floor. |
| 3 | A70000002B9A4F21 | Living room 1m–2m from floor. |
| 4 | A70000002BAE8D21 | Outside, under shelter, 1m–2m from ground. |
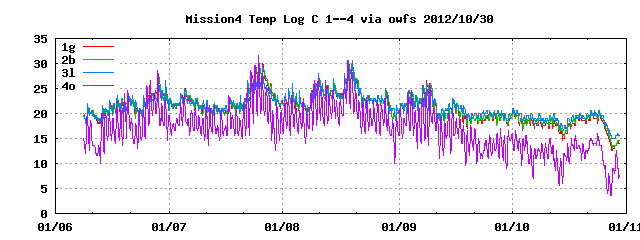
: first full sample set, running to 14th June (still with probable hour offset):
- girl's room 1
.dat*nx timestamp and degrees C - boy's room 2
.dat*nx timestamp and degrees C - living room 3
.dat*nx timestamp and degrees C - outside 4
.dat*nx timestamp and degrees C
See .png graph.
: full sample set shortly after triple-glazing (still with probable hour offset):
- girl's room 1
.dat*nx timestamp and degrees C - boy's room 2
.dat*nx timestamp and degrees C - living room 3
.dat*nx timestamp and degrees C - outside 4
.dat*nx timestamp and degrees C
See .png graph.
: full sample set after cold night (still with probable hour offset):
- girl's room 1
.dat*nx timestamp and degrees C - boy's room 2
.dat*nx timestamp and degrees C - living room 3
.dat*nx timestamp and degrees C - outside 4
.dat*nx timestamp and degrees C
See .png graph.
: full sample set after several cold days and no central heating yet; note that the house was empty for a day and then had one occupant for two days up to today (still with probable hour offset):
- girl's room 1
.dat*nx timestamp and degrees C - boy's room 2
.dat*nx timestamp and degrees C - living room 3
.dat*nx timestamp and degrees C - outside 4
.dat*nx timestamp and degrees C
See .png graph.
: full sample set with central heating on a couple of days (still with probable hour offset):
- girl's room 1
.dat*nx timestamp and degrees C - boy's room 2
.dat*nx timestamp and degrees C - living room 3
.dat*nx timestamp and degrees C - outside 4
.dat*nx timestamp and degrees C
See .png graph.
It is clear that the in-house temperatures are all fairly close, but I think that it's also evident that the living room seems to be warmest and the girl's room (with the least good insulation) coolest, which probably argues in favour of beefing up the insulation there. (I'm also going to at least test a smarter electronic TRV in her room soon.)
: full sample set (still with probable hour offset):
- girl's room 1
.dat*nx timestamp and degrees C - boy's room 2
.dat*nx timestamp and degrees C - living room 3
.dat*nx timestamp and degrees C - outside 4
.dat*nx timestamp and degrees C
See .png graph.
: i30 Programmable TRV installed in girl's room with main bed-time slot of 2h@19°C preceded by a 1h@17°C shoulder in case the room is really cold, and possible morning slot (if CH running) of 1h@19°C preceded by a 30m@16°C shoulder. It is not clear if this will have any visible effect on the trace.

: full sample set (still with probable hour offset):
- girl's room 1
.dat*nx timestamp and degrees C - boy's room 2
.dat*nx timestamp and degrees C - living room 3
.dat*nx timestamp and degrees C - outside 4
.dat*nx timestamp and degrees C
See .png graph, and some histogram data
in particular noting the much narrower temperature range inside than outside and the lower (18–19.5°C) modal temperatures for the bedroom than the living room (20–21.5°C).
By the end of mission 4, drift of the button clocks from true time over ~6M is: button 1 ~105s, button 2 ~234s, button 3 ~306s, button 4 ~177s.
: Mission 5
As of I am starting mission 5 with the same locations as mission 4, but with a 4 hour sample interval (samples at 00h, 04h, 08h, 12h, 16h, 20h UTC) to allow collection of just under one year's data continuously.
| Number | Device ID | Target Location |
|---|---|---|
| 1 | A70000002B776221 | Girl's room 1m–2m from floor. |
| 2 | A70000002B82C321 | Boy's room 1m–2m from floor. |
| 3 | A70000002B9A4F21 | Living room 1m–2m from floor. |
| 4 | A70000002BAE8D21 | Outside, under shelter, 1m–2m from ground. |
: full sample set:
- girl's room 1
.dat*nx timestamp and degrees C - boy's room 2
.dat*nx timestamp and degrees C - living room 3
.dat*nx timestamp and degrees C - outside 4
.dat*nx timestamp and degrees C
See .png graph.
: full sample set, with rest of family away so internal temperatures allowed to fall in monitored rooms for the last few days to ~14°C, and what may be less temperature overshoot above the 18–19°C target in the living room (in getting the children's rooms warm before bedtime) over the last couple of weeks since the OpenTRV V0.09 unit was deployed (there and elsewhere):
- girl's room 1
.dat*nx timestamp and degrees C - boy's room 2
.dat*nx timestamp and degrees C - living room 3
.dat*nx timestamp and degrees C - outside 4
.dat*nx timestamp and degrees C
See .png graph.

: full sample set, family back so temperatures back up but less than before to achieve comfort:
- girl's room 1
.dat*nx timestamp and degrees C - boy's room 2
.dat*nx timestamp and degrees C - living room 3
.dat*nx timestamp and degrees C - outside 4
.dat*nx timestamp and degrees C
See .png graph.
: full sample set, ending the coldest spring in 50 years (though central heating off in , still sometimes using MHRV):
- girl's room 1
.dat*nx timestamp and degrees C - boy's room 2
.dat*nx timestamp and degrees C - living room 3
.dat*nx timestamp and degrees C - outside 4
.dat*nx timestamp and degrees C
See .png graph.
: full sample set after quite a warm summer:
- girl's room 1
.dat*nx timestamp and degrees C - boy's room 2
.dat*nx timestamp and degrees C - living room 3
.dat*nx timestamp and degrees C - outside 4
.dat*nx timestamp and degrees C
See .png graph.
: full sample set, with the devices full a couple of days ago:
- girl's room 1
.dat*nx timestamp and degrees C - boy's room 2
.dat*nx timestamp and degrees C - living room 3
.dat*nx timestamp and degrees C - outside 4
.dat*nx timestamp and degrees C
See .png graph.
: Mission 6
As of I am starting mission 6 with the same locations and (4 hour) sample interval as mission 5 to allow collection of just under one year's data continuously.
There is a break of a couple of days between the end of mission 5 and the start of mission 6. Note though that the heating is not yet on so this run will capture the full heating season.
| Number | Device ID | Target Location |
|---|---|---|
| 1 | A70000002B776221 | Girl's room 1m–2m from floor. |
| 2 | A70000002B82C321 | Boy's room 1m–2m from floor. |
| 3 | A70000002B9A4F21 | Living room 1m–2m from floor. |
| 4 | A70000002BAE8D21 | Outside, under shelter, 1m–2m from ground. |

: early full sample set, with heating 'officially' just on over last day or so (girl's room nominal 19°C target, boy's and living room nominal sub-18°C target in use):
- girl's room 1
.dat*nx timestamp and degrees C - boy's room 2
.dat*nx timestamp and degrees C - living room 3
.dat*nx timestamp and degrees C - outside 4
.dat*nx timestamp and degrees C
See .png graph.
The buttons in the bedrooms have been tucked into a bookshelf. So they are probably 'seeing' the solid furniture temperature rather than air temperature. This may be misleading with shorter and more targeted heat-on times. So I'll attempt to expose the buttons to a little more air-flow by simply moving them nearer the front of the shelves.
: full sample set, with girl's room now on OpenTRV-regulated 18°C nominal bed-time target. The house was then fully unoccupied for a few days prior to the end of this period. Note how the temperature of the least-insulated (girl's) room dropped the most:
- girl's room 1
.dat*nx timestamp and degrees C - boy's room 2
.dat*nx timestamp and degrees C - living room 3
.dat*nx timestamp and degrees C - outside 4
.dat*nx timestamp and degrees C
See .png graph.
(Button 2 was wrongly placed alongside button 1 after this reading until .)
: full sample set:
- girl's room 1
.dat*nx timestamp and degrees C - boy's room 2
.dat*nx timestamp and degrees C - living room 3
.dat*nx timestamp and degrees C - outside 4
.dat*nx timestamp and degrees C
See .png graph.
: full sample set:
- girl's room 1
.dat*nx timestamp and degrees C - boy's room 2
.dat*nx timestamp and degrees C - living room 3
.dat*nx timestamp and degrees C - outside 4
.dat*nx timestamp and degrees C
See .png graph.

: full sample set up until the iButtons filled:
- girl's room 1
.dat*nx timestamp and degrees C - boy's room 2
.dat*nx timestamp and degrees C - living room 3
.dat*nx timestamp and degrees C - outside 4
.dat*nx timestamp and degrees C
See .png graph.
: the iButtons filled up a month ago, and I now have much finer-grained real-time data coming in over OpenTRV sensors (see below), so I have turned off the real-time clocks in the iButtons to conserve whatever battery life they have left so that I can possibly deploy them on ad-hoc projects elsewhere.
The internal clocks had drifted a little over the ~11 month run, up to about 11 minutes max, ie about 1 minute per month max (2s/d), which is to be expected from wristwatch-like RTCs. (1's drift was 199s (fast), 2 498s, 3 662s, 4 334s).
It is fairly clear from this last graph that external temperatures are significantly below internal temperatures November to March (the start of the graph) which is why heat is needed.
It is also interesting that while exterior temperatures range from about freezing up to ~30°C, the internal range is typically ~15°C–20°C, being pushed up higher in summer but still being more moderate.
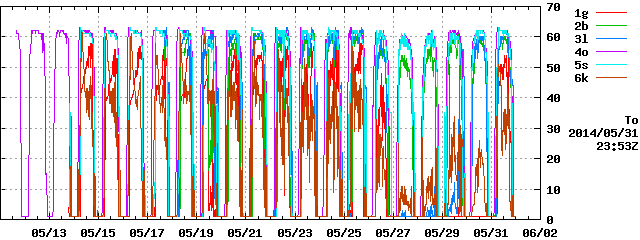
: OpenTRV Monitoring Started

- girl's room 1g
- boy's room 2b
- living room 3l
- outside 4o
- study 5s
- kitchen 6k
As of the end of it became possible to use the OpenTRV units installed around the house to provide automated 'live' monitoring of temperatures to 1/16th C precision and with approximately 4-minute sampling. These readings overlap with the iButtons and can also provide live on-time/HDD measures with further development work.
(Note that both the study and kitchen readings are slightly high, ~0.5°C, from self-heating from their radio receivers being on all the time as hubs.)
Note that on to where as an experiment I kept the doors closed and curtains drawn for rooms 1g (only a small amount of IWI) and 3l (complete IWI). The temperature falls faster and further in 1g. 2b, also well insulated, behaves like 3l (though its door and curtains were mainly open). See also light levels for those 4 days and for the end of .
Dataset
- name
- 16WW iButton interior temperature monitoring
- description
- 16WW iButton interior temperature monitoring over 6 missions
- version
- 1
- keywords
- iButton, domestic, temperature, monitoring
- date published
- 2011
- date modified
- 2014
- variable measured
- temperature
- temporal coverage
- 2011/2014
- spatial coverage
- UK centre 51.406696N,-0.288789E elevation 16m
- distribution
- directory
- distribution
-
.datfiles in ZIP archive - canonical URL
- this descriptive text with markup
- is part of
- 16WW Dataset
- licence
- this dataset is licensed under CC0, ie it is effectively public domain; if you make use of this data, attribution is welcome but not required
- is accessible for free
- true