Earth Notes: Saving Electricity and Gas (2017)
Updated 2024-02-26 11:22 GMT.By Damon Hart-Davis.


2017
2017 data (kWh: e used 1862, e gen -3794, g 3423).
Off-grid 99.2kWh captured by primary (MPPT) solar controller.
See the daily PV generation logs for 2017 as .csv and .png chart.
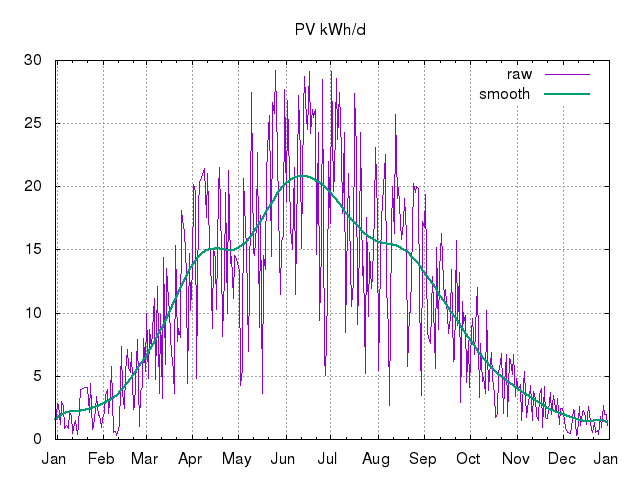

See gas use kWh and heating degree days (HDD) by time for 2017 as .csv and .png chart.

See gas kWh vs heating degree days (HDD) regression for 2017 as .png chart.
2017-05: Ecotricity sent our annual summaries for electricity and gas, stating that we had used just over 1.3MWh of electricity (~£270) and a ~4.2MWh of gas (~£262).
The gas figure is higher than usual, given that it was a cold winter. ~3.5MWh would be more typical (maybe ~£250).
Given that we don't yet have a heat-pump, but that resistance heating is beginning to approach the carbon intensity of gas on the GB grid (currently ~300gCO2/kWh vs ~190gCO2/kWh), what would be the effect of moving from gas to electricity for all heat including water (DHW)?
At ~17p/kWh for electricity that 3.5MWh would be ~£600. But getting rid of gas and its standing charge and an annual gas boiler inspection/service would leave us 'just' net ~£250 per year worse off. So we might expect a £900/year electricity bill, rather than a £550 dual-fuel total (+~£100 maintenance).
Moving all our DWH consumption to solar PV that we'd otherwise export (eg with the help of a resistance-driven Sunamp store) would be roughly cost neutral, since the gas per-kWh cost is similar to what we are paid for electricity exports.
Even in the depths of winter, we export in electricity ~10% of what we consume in gas. A heat-pump and store could double that to ~20%, still requiring us to import the remaining 80%. In the shoulder months with a suitable Sunamp-like store we could probably cover all space heating. Without a heat-pump the effect on utility bills of using our own power locally is roughly neutral, though kind to the grid in avoiding shipping that energy back and forth.
2017-09-22: I just had to fork out ~£250 for a boiler repair, most of which was the cost of a new diverter valve. (And it took several attempts to find someone available, which ate a lot of time.)
2018-01-01 18:23Z: total solar PV generation from the grid-tied PV to date, as reported via the inverters and the Sunny Beam, is 33,666.4kWh.
| 2017 | Electricity | Gas | |||
|---|---|---|---|---|---|
| Month | Consumed kWh (/d) | Generated -kWh (/d) | Consumed kWh (/d) | Period | Notes |
| 2017-01 | 207 (6.7/d) | -71 (-2.3/d) | 867 (28/d) | 20161231T18:29Z to 20170131T18:44Z (31d) | Meter readings: electricity generation 70.6kWh, export 41.1kWh, import 177.7kWh (thus net consumption (I+G-E) 207.2kWh); gas ~77.2m^3 (so 867kWh @ 11.1kWh/m^3).
HDD12=248 vs 173 last January. |
| 2017-02 | 163 (5.8/d) | -109 (-3.9/d) | 497 (18/d) | 20170131T18:44Z to 20170228T23:37Z (28d) | Meter readings: electricity generation 109.4kWh, export 78.8kWh, import 132.4kWh (thus net consumption (I+G-E) 163.0kWh); gas ~44.8m^3 (so 497kWh @ 11.1kWh/m^3).
HDD12=139 vs 199 last February. |
| 2017-03 | 166 (5.4/d) | -300 (-9.7/d) | 357 (12/d) | 20170228T23:37Z to 20170331T16:29Z (31d) | Meter readings: electricity generation 300.2kWh, export 244.3kWh, import 110.0kWh (thus net consumption (I+G-E) 165.9kWh); gas ~32.1m^3 (so 357kWh @ 11.1kWh/m^3).
HDD12=77 vs 162 last March. |
| 2017-04 | 143 (4.8/d) | -482 (-16/d) | 117 (3.9/d) | 20170331T16:29Z to 20170430T20:45Z (30d) | Meter readings: electricity generation 481.9kWh, export 407.5kWh, import 68.8kWh (thus net consumption (I+G-E) 143.2kWh); gas ~10.5m^3 (so 117kWh @ 11.1kWh/m^3).
HDD12=65 vs 104 last April. |
| 2017-05 | 149 (4.8/d) | -528 (-17/d) | 142 (4.6/d) | 20170430T20:45Z to 20170521T19:54Z (31d) | Meter readings: electricity generation 527.7kWh, export 450.5kWh, import 71.5kWh (thus net consumption (I+G-E) 148.7kWh); gas ~12.8m^3 (so 142kWh @ 11.1kWh/m^3).
HDD12=23 vs 23 last May. |
| 2017-06 | 139 (4.6/d) | -622 (-21/d) | 109 (3.6/d) | 20170521T19:54Z to 20170630T19:28Z (30d) | Meter readings: electricity generation 621.7kWh, export 545.4kWh, import 63.1kWh (2.1kWh/d) (thus net consumption (I+G-E) 139.4kWh, self consumption ((N-I)/N) 55%); gas ~9.8m^3 (so 109kWh @ 11.1kWh/m^3).
HDD12=1 vs 2 last June. |
| 2017 running total (Jan--Jun) | 967 (5.3/d) | -2112 (-12/d) | 2079 (11/d) | 20161231T18:29Z to 20170630T19:28Z (181d) | Implies total footprint to date -46kgCO2: electricity (average 223W gross) -492kgCO2e @ 0.43kgCO2/kWh (netted), gas 395kgCO2e @ 0.19kgCO2/kWh. |
| 2017-07 | 147 (4.8/d) | -561 (-18/d) | 105 (3.4/d) | 20170630T19:28Z to 20170731T18:56Z (31d) | Meter readings: electricity generation 560.5kWh, export 477.3kWh, import 64.2kWh (2.1kWh/d) (thus net consumption (I+G-E) 147.4kWh, self consumption ((N-I)/N) 57%); gas ~9.5m^3 (so 105kWh @ 11.1kWh/m^3).
HDD12=0 vs 0 last July. |
| 2017-08 | 97 (2.9/d) | -519 (-16/d) | 60 (1.8/d) | 20170731T18:56Z to 20170902T17:26Z (33d) | Meter readings: electricity generation 519.0kWh, export 472.3kWh, import 50.1kWh (1.5kWh/d) (thus net consumption (I+G-E) 96.9kWh, self consumption ((N-I)/N) 48%); gas ~5.4m^3 (so 60kWh @ 11.1kWh/m^3).
Two weeks' holiday reduced fuel demand as expected. Baseline gas demand is ~0 at this time of year (demand DHW only). Baseline electricity demand is ~1kWh/d, mainly for fridge (imports 0.8kWh/d while away). Compare daily consumption w/ July, given ~50% absence this month. HDD12=1 vs 0 last August. |
| 2017-09 | 143 (5.1/d) | -287 (-10/d) | 113 (4.0/d) | 20170902T17:26Z to 20170930T19:26Z (28d) | Meter readings: electricity generation 287.3kWh, export 234.7kWh, import 90.8kWh (3.2kWh/d) (thus net consumption (I+G-E) 143.4kWh, self consumption ((N-I)/N) 37%); gas ~10.2m^3 (so 113kWh @ 11.1kWh/m^3).
Reduced support from off-grid may account for higher electricity. HDD12=10 vs 2 last September. |
| 2017-10 | 150 (4.8/d) | -180 (-5.8/d) | 101 (3.3/d) | 20170930T19:26Z to 20171031T18:34Z (31d) | Meter readings: electricity generation 179.7kWh, export 142.3kWh, import 112.1kWh (3.6kWh/d) (thus net consumption (I+G-E) 149.5kWh, self consumption ((N-I)/N) 25%); gas ~9.1m^3 (so 101kWh @ 11.1kWh/m^3).
HDD12=18 vs 38 last October. |
| 2017-11 | 179 (6.0/d) | -91 (-3.0/d) | 344 (11/d) | 20171031T18:34Z to 20171130T22:12Z (30d) | Meter readings: electricity generation 90.6kWh, export 63.0kWh, import 151.5kWh (5.1kWh/d) (thus net consumption (I+G-E) 179.1kWh, self consumption ((N-I)/N) 15%); gas ~31.0m^3 (so 344kWh @ 11.1kWh/m^3).
HDD12=128 vs 154 last November. |
| 2017-12 | 178 (5.7/d) | -46 (-1.5/d) | 619 (20/d) | 20171130T22:12Z to 20171231T18:45Z (31d) | Meter readings: electricity generation 45.8kWh, export 23.8kWh, import 156.1kWh (5.0kWh/d) (thus net consumption (I+G-E) 178.1kWh, self consumption ((N-I)/N) 12%); gas ~55.8m^3 (so 619kWh @ 11.1kWh/m^3).
HDD12=187 vs 160 last December. |
| 2017 total (Jan--Dec) | 1862 (5.10/d) | -3794 (-10.4/d) | 3423 (9.38/d) | 20161231T18:29Z to 20171231T18:45Z (365d) |
HDD (897 vs 990) and gas usage (3851kWh last year) both down.
Electricity use and generation both up slightly. Note that grid electricity carbon intensity dropped significantly again in 2017, which would reduce the benefit of our electricity exports, but previous (0.43kgCO2/kWh) figures will be used for comparison. |
| kgCO2 | 801kg (2.2/d) | -1632kg (-4.5/d) | 650kg (1.8/d) | ~-0.18tCO2 (~-0.50kgCO2/d) gas/electricity emissions total for 4 people, based on 0.43kgCO2/kWh for electricity (netted) and 0.19kgCO2/kWh for gas, ie slightly carbon negative. Note that we have not flown this year again, we still do not own a car and travel almost entirely by (usually-electrified) public transport. | |